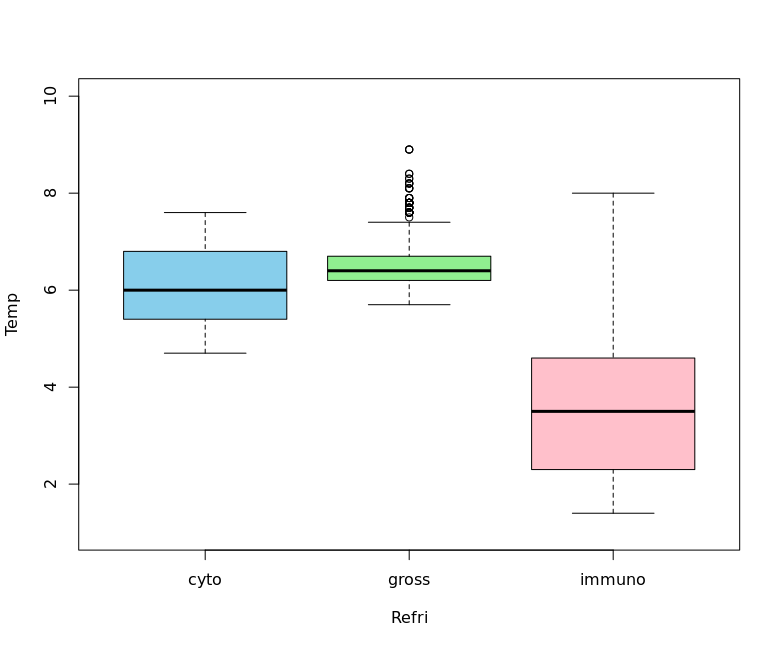
gross 항목의 whisker를 구해보도록 하자. boxplot의 위쪽 whisker는 (Q3-Q1) * 1.5 를 넘어서는 값으로 알려져 있다.

Box plot – Wikipedia
In descriptive statistics, a box plot or boxplot is a method for demonstrating graphically the locality, spread and skewness groups of numerical data through their quartiles.[1] In addition to the box on a box plot, there can be lines (which are called whiskers) extending from the box indicating variability outside the upper and lower quartiles, thus, the plot is also called the box-and-whisker plot and the box-and-whisker diagram. Outliers that differ significantly from the rest of the dataset[2] may be plotted as individual points beyond the whiskers on the box-plot.
Box plots are non-parametric: they display variation in samples of a statistical population without making any assumptions of the underlying statistical distribution[3] (though Tukey’s boxplot assumes symmetry for the whiskers and normality for their length). The spacings in each subsection of the box-plot indicate the degree of dispersion (spread) and skewness of the data, which are usually described using the five-number summary. In addition, the box-plot allows one to visually estimate various L-estimators, notably the interquartile range, midhinge, range, mid-range, and trimean. Box plots can be drawn either horizontally or vertically.
Box plots are non-parametric: they display variation in samples of a statistical population without making any assumptions of the underlying statistical distribution[3] (though Tukey’s boxplot assumes symmetry for the whiskers and normality for their length). The spacings in each subsection of the box-plot indicate the degree of dispersion (spread) and skewness of the data, which are usually described using the five-number summary. In addition, the box-plot allows one to visually estimate various L-estimators, notably the interquartile range, midhinge, range, mid-range, and trimean. Box plots can be drawn either horizontally or vertically.
boxplot.stats() 을 이용하면 구할 수 있다. dataframe이나 list 형식의 자료는 처리할 수 없다. pull()을 이용해서 자료를 추출한다.
> boxplot.stats(dt %>% filter(Refri == 'gross') %>% pull(Temp))$stats
[1] 5.7 6.2 6.4 6.7 7.4
$n
[1] 1647
$conf
[1] 6.380534 6.419466
$out
[1] 8.9 8.9 8.4 8.4 8.2 7.8 7.6 7.6 7.6 7.6 7.7 7.8 7.8 7.8 8.1 7.8 7.7 7.8 7.8 8.1 7.6 7.8 7.7 7.6 7.9 7.8 7.8 7.7 7.6 7.9 8.1 8.3 7.8 8.2 7.6 7.8 7.7 7.9 7.5 7.7 7.8 7.7 7.6 7.8 7.8
[46] 8.1 8.2 7.6 7.8 7.6 7.6 8.9 8.2 8.3 7.6 7.9 7.6그러면 $out 항목에서 whisker 값을 알 수 있다.
사용할 때 주의할 점. 이렇게 구한 것은 coef = 1.5가 기본값이다. 통계의 주요 5값을 구하려면 coef = 0을 지정해야 한다.
