RStudio Server를 설치할 경우 libssl1.1이 필요하다는 경우가 있다. 아래 링크에서 다운 받아서 설치한다.
Category: R
-
boxplot의 whisker 구하기
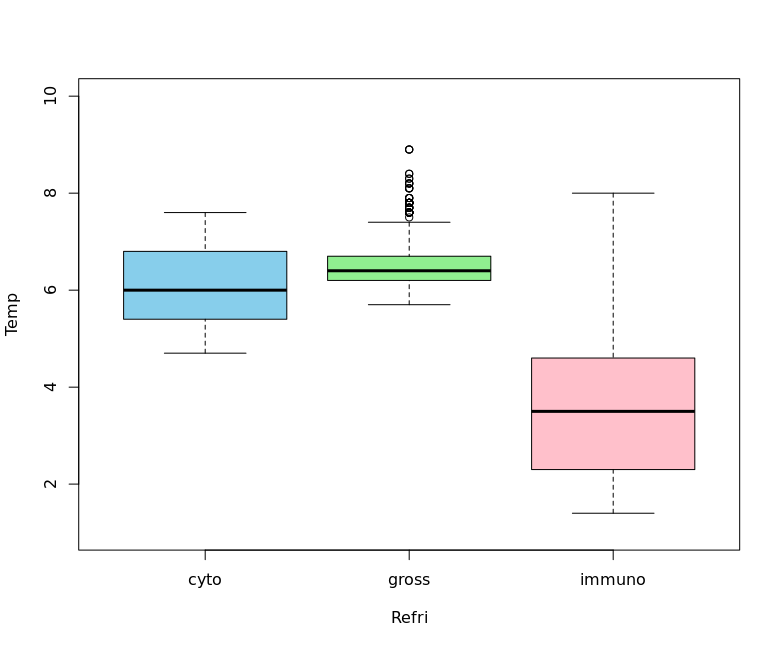
gross 항목의 whisker를 구해보도록 하자. boxplot의 위쪽 whisker는 (Q3-Q1) * 1.5 를 넘어서는 값으로 알려져 있다.
 Box plot – WikipediaIn descriptive statistics, a box plot or boxplot is a method for demonstrating graphically the locality, spread and skewness groups of numerical data through their quartiles.[1] In addition to the box on a box plot, there can be lines (which are called whiskers) extending from the box indicating variability outside the upper and lower quartiles, thus, the plot is also called the box-and-whisker plot and the box-and-whisker diagram. Outliers that differ significantly from the rest of the dataset[2] may be plotted as individual points beyond the whiskers on the box-plot.
Box plots are non-parametric: they display variation in samples of a statistical population without making any assumptions of the underlying statistical distribution[3] (though Tukey’s boxplot assumes symmetry for the whiskers and normality for their length). The spacings in each subsection of the box-plot indicate the degree of dispersion (spread) and skewness of the data, which are usually described using the five-number summary. In addition, the box-plot allows one to visually estimate various L-estimators, notably the interquartile range, midhinge, range, mid-range, and trimean. Box plots can be drawn either horizontally or vertically.boxplot.stats() 을 이용하면 구할 수 있다. dataframe이나 list 형식의 자료는 처리할 수 없다. pull()을 이용해서 자료를 추출한다.
> boxplot.stats(dt %>% filter(Refri == 'gross') %>% pull(Temp))$stats [1] 5.7 6.2 6.4 6.7 7.4 $n [1] 1647 $conf [1] 6.380534 6.419466 $out [1] 8.9 8.9 8.4 8.4 8.2 7.8 7.6 7.6 7.6 7.6 7.7 7.8 7.8 7.8 8.1 7.8 7.7 7.8 7.8 8.1 7.6 7.8 7.7 7.6 7.9 7.8 7.8 7.7 7.6 7.9 8.1 8.3 7.8 8.2 7.6 7.8 7.7 7.9 7.5 7.7 7.8 7.7 7.6 7.8 7.8 [46] 8.1 8.2 7.6 7.8 7.6 7.6 8.9 8.2 8.3 7.6 7.9 7.6그러면 $out 항목에서 whisker 값을 알 수 있다.
사용할 때 주의할 점. 이렇게 구한 것은 coef = 1.5가 기본값이다. 통계의 주요 5값을 구하려면 coef = 0을 지정해야 한다.
-
RStudio Server in Docker
sudo docker rm -f rstudio sudo docker run -it \ --name rstudio \ --restart always \ --dns 8.8.8.8 \ -p 8788:8787 \ --add-host rcc.work:192.168.126.37 \ debian echo 'Acquire::http::Proxy "http://rcc.work:3142";' > /etc/apt/apt.conf rm -rf /etc/localtime ln -s /usr/share/zoneinfo/Asia/Seoul /etc/localtime apt-get -y update && apt-get -y upgrade apt-get -y install dialog gpg wget locales sudo apt-key adv --keyserver keyserver.ubuntu.com --recv-keys B8F25A8A73EACF41 gpg --keyserver keyserver.ubuntu.com \ --recv-key '95C0FAF38DB3CCAD0C080A7BDC78B2DDEABC47B7' echo 'deb http://cloud.r-project.org/bin/linux/debian bookworm-cran40/' >> /etc/apt/sources.list #ttps://debian.pkgs.org/11/debian-main-amd64/libssl1.1_1.1.1w-0+deb11u1_amd64.deb.html wget http://ftp.de.debian.org/debian/pool/main/o/openssl/libssl1.1_1.1.1w-0+deb11u1_amd64.deb -
refresh using shinyjs
Shiny에서 refresh 기능을 이용해야 할 경우가 있다. 그러니까 F5 키를 누르지 않고도 새로 고침을 해야할 때이다. shinyjs를 사용하는 방법이 있다.
설치는 다음과 같이 한다.
install.packages("remotes")
remotes::install_github("daattali/shinyjs")
다음에는 ui 부분에서 useShinyjs() 를 적용한다.
ui <- fluidPage(
  useShinyjs(),
  )
다음은 observeEvent 에서 refresh() 를 넣어주면 해당 부분이 실행될 때마다 새로 고침이 된다.
  observeEvent(input$insert_tic, {
    refresh()
  })