
보통 이럴 때에는 후달린다는 표현을 쓰는데…
결국엔 만들 수 있었다. 수 많은 옵션을 사용하면 되기는 되네. 😉
스크립트는 나중에 수정한 것을 썼기 때문에, 사진 파일과 다르다. ㅋ
cex.figure <- 1.7
lwd.figure <- 6
par(mai=c(1.5, 1.5, 0.5, 0.5), family=”Arial”)
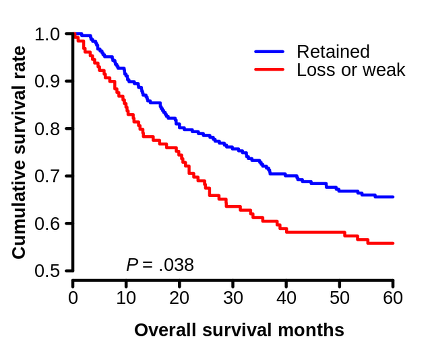
plot(survfit(figure.surv), col=c(“blue”, “red”), ylim=y.lim, conf.int = FALSE, xlab=x.label, ylab=y.label, lty=1, lwd=lwd.figure, mark.time=TRUE, mgp=c(3.5, 1, 0), cex.lab=cex.figure, font.axis=1, font.lab=2, axes=F)
axis(side=1, las=1, lwd=lwd.figure, cex.axis=cex.figure)
axis(side=2, las=1, lwd=lwd.figure, cex.axis=cex.figure)
text(10, 0.02, expression(italic(P), ” = .042″), adj=c(0, 0), cex=cex.figure)
legend(100, 0.2, c(“Retained”, “Loss or weak”), col=c(“blue”, “red”), lty=c(1, 1), xjust=1, yjust=1, bty=”n”, cex=cex.figure, lwd=c(rep(lwd.figure, 2)))
Leave a Reply